1. Introduction
The following is intended as documentation on how to submit jobs to the RaptorX servers, and retrieve and interpret results. For detailed explanation of the algorithms deployed please see relevant papers listed at http://raptorx.uchicago.edu/about/#cite .
2. Quick Interpretation Of Results
- Domain parsing
- Here a domain shall be interpreted as a modeling unit. That is, the query sequence is partitioned into units based upon template structures in PDB. Two domains may be modeled as a single unit if they share a single template; otherwise, as two different modeling units. Note that in the 3D model of the whole sequence the relative orientation of two modeling units are unreliable since they do not share the same template.
- Secondary structure prediction
- For 3-state secondary structure, H, E, and C represent Helix, Beta-sheet and Loop, respectively.
- Solvent accessibility (ACC)
- The solvent accessibility is divided into three states by 2 cutoff values: 10% and 42%. Buried for less than 10%, Exposed for larger than 42% and Medium for between 10% and 42%. Buried, Medium and Exposed are also abbreviated as B, M and E, respectively.
RaptorX uses a few measures including P-value, Score, uGDT and GDT, uSeqID and SeqID to evaluate the quality of a predicted 3D structure model.
- Score
- score is the alignment score falling between 0 and the (domain) sequence length, with 0 indicating the worst. In practice, Score may slightly go beyond the sequence length due to estimation error.
- uSeqID and SeqID
- uSeqID is the number of identical residues in the alignment. SeqID is uSeqID normalized by the protein (or domain) sequence length and multiplied by 100. The higher the uSeqID (SeqID), the better. If the SeqID > 30% and the protein (or domain) has >200 residues, it usually indicates that the predicted model has a correct fold.
- uGDT and GDT
- uGDT is the unnormalized GDT (Global Distance Test) score defined as 1*N(1)+0.75*N(2)+0.5*N(4)+0.25*N(8), where N(x) is the number of residues with estimated modeling error (in Å) smaller than x. GDT is calculated as uGDT divided by the protein (or domain) length and multiplied by a 100. uGDT(GDT) measures the absolute model quality. For a protein with >100 residues, uGDT>50 is a good indicator. For a protein with <100 residues, GDT>50 is a good indicator. If a model has good uGDT (>50) but bad GDT (<50), it indicates that only a small portion of the model may be good.
- P-value
- P-value is the likelihood of a predicted model being worse than the best of a set of randomly-generated models for this protein (or domain), so P-value evaluates the relative quality of a model. The smaller the P-value, the higher quality the model. For mainly alpha proteins, P-value less than 10^-3 is a good indicator. For manly beta proteins, P-value less than 10^-4 is a good indicator
To judge the quality of a predicted model, three measures P-value, Score and uGDT(GDT) shall be taken into consideration together. A model with both good P-value and uGDT(GDT) is very likely to be of high quality. A model with good P-value but very bad uGDT may be of low quality even if it is much better than randomly-generated models. A model with a good uGDT, but poor P-value may be of OK quality although it may not be better than the best randomly-generated models. Ideally, Score shall approximately equal to uGDT, but sometimes they differ a lot, so it is better to use (Score + uGDT)/2 to estimate the model quality. In addition, Score, uGDT and P-value is also biased by the protein (or domain) sequence length. The longer the protein (or domain), the more likely RaptorX can build a model with better Score, uGDT and P-value. This is why GDT shall also be taken into account to evaluate the quality of a model. We will add a new measure very soon to cancel out the length bias.
- Pocket Multiplicity
- For binding site prediction, in addition to P-value, uGDT(GDT), uSeqID(SeqID), one more measure Pocket Multiplicity is used to judge the quality of a predicted pocket. It represents the frequency with which the selected pocket was found in a set of ligand-binding protein structures. The higher, the better. When it is above 40, there is a good chance that the predicted pocket is true.
3. Job Submission And User Account
- Job submission
- Clicking the “Submit” link will display a form where the user can submit jobs. The “Job Identification” section allows the user to provide a job name (default is ‘my job’) and an email address to be used for notification when the job has finished (if you are already logged in this field will be pre-filled). The email provided here will also serve as the username by which the job account is identified on the server for accessing results at a later time. The “Sequences for Prediction” section is where the user submits one or more sequences in FASTA format. The sequence(s) can either be supplied by copy-and-pasting into the text box or by uploading a flat text file containing the data. Successful submission will redirect the user to a page showing the status of this submitted job.
- Account
We strongly suggest you to provide an email address in submission, which will facilitate the retrieval of your jobs. A new user account tied to your email address is automatically created when you submit your first prediction job. In the case that you do not provide an email address, the only way to check the status of your job is through a JobID assigned by the servers. If you forget your JobID, you will have to contact the RaptorX team to retrieve your job.
When your account is first created (after you submitted your first job) you are automatically logged into the server on the machine you are using at that point in time. If the login from a previous session has expired or the account needs accessed from a different machine on which it was initially created, you will need to go to the server front page http://raptorx.uchicago.edu and supply your account email in the login field on the right. Few minutes after submission of the form you will receive an email with a hyperlink to the page containing the jobs for the account.
- Notes
- Each user can have no more than 500 sequences pending prediction at any point in time and a single job can contain at most 10 sequences. Further, the results of a job are guaranteed to be stored for only 14 days after the job is completed, although empirically all the jobs were stored for at least several months. To store your jobs for a much longer time for publications, please contact the RaptorX team through the "Inquiry & Bug Report" link.
4. Job Monitoring And Job Availability
There are two ways to track pending and finished jobs. One is to use the JobID and the other is email address.
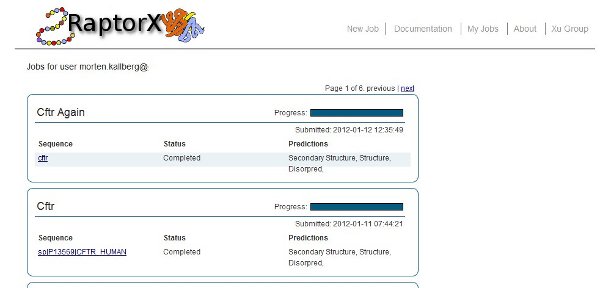
- By email address
- The user needs to be logged in to the server. Refer to Section 2 of this manual for login instructions. Once logged in to the server, selecting “My Jobs” in the menu at the top of the page display a job overview page similar to the one depicted below. Here the status of each prediction in the job is given along with overall information of the predictions being done for each sequence submitted. To track the job status in real-time simply refresh the page and the completion status of the prediction submitted for each sequence in a job will be updated. Clicking on a sequence name will take the user to the result page for this sequence.
- By Job ID
- Use the "Retrieve Results by JobID" or the "Job status" link. The remaining procedure is similar to job retrieval by email address.
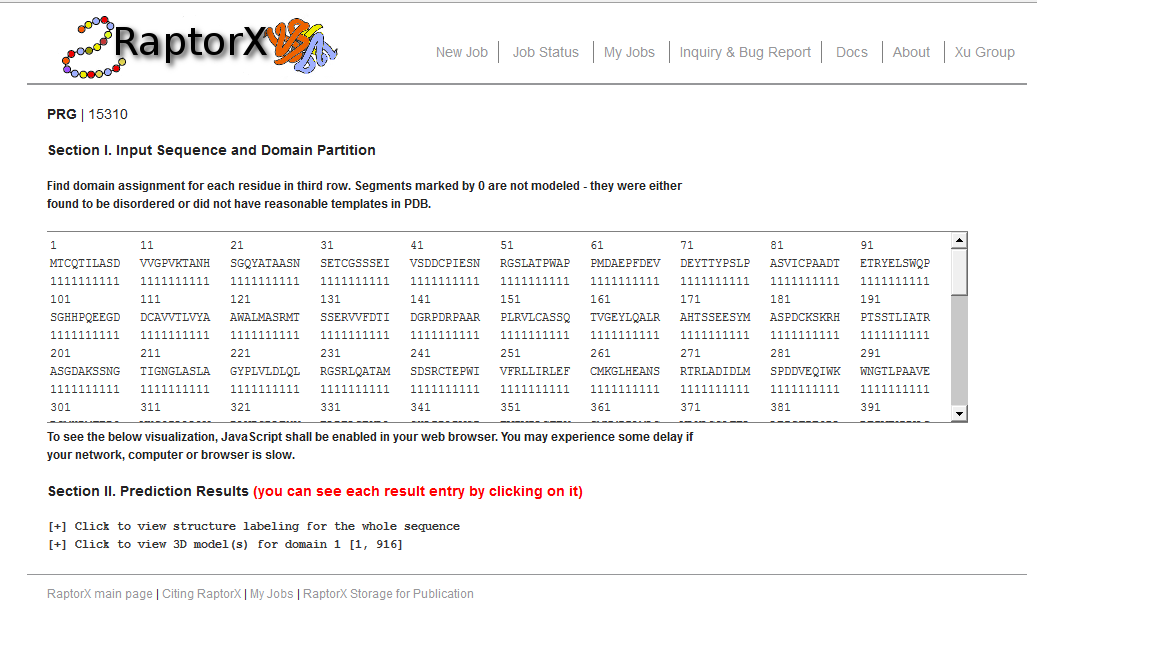
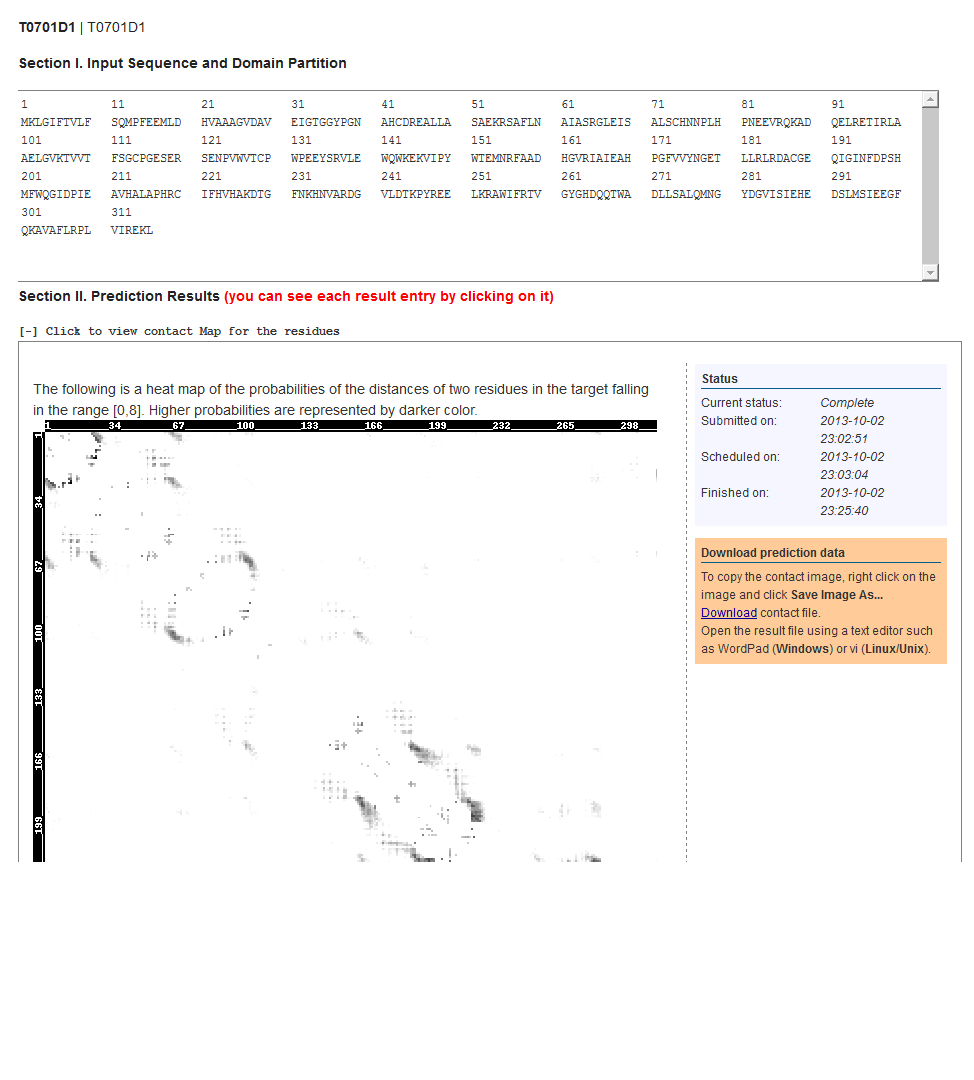
5. Result Overview Page
The below figure shows the overview result web page, which consists of a couple of sections. The first section is the input sequence and its domain partition. The second section contains detailed prediction result. Meanwhile, you can click to view the structure labeling including 3-state and 8-state secondary structure prediction, disorder prediction and solvent accessibility prediction. You can also click to view the 3D structure modeling for each domain.
6. Tertiary Structure Prediction
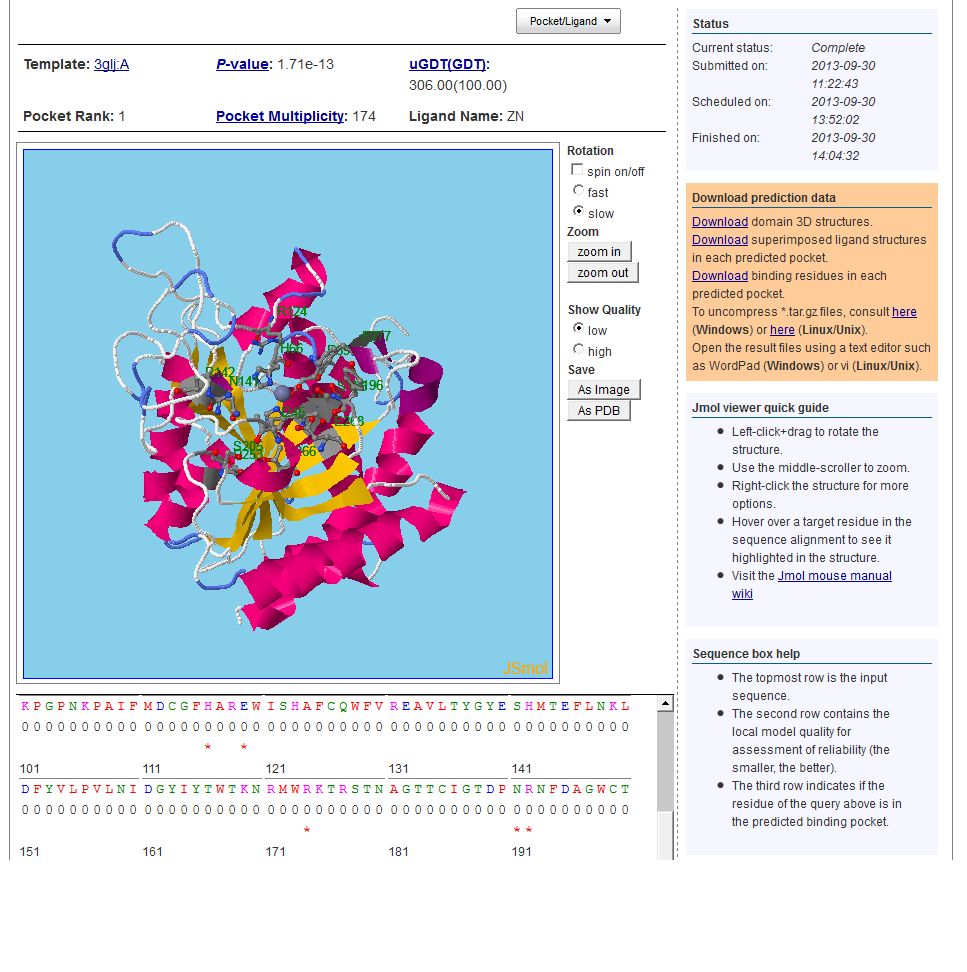
Click on "Click to view 3D models for domain ..." to display a teritiary structure prediction page similar to the one depicted below.
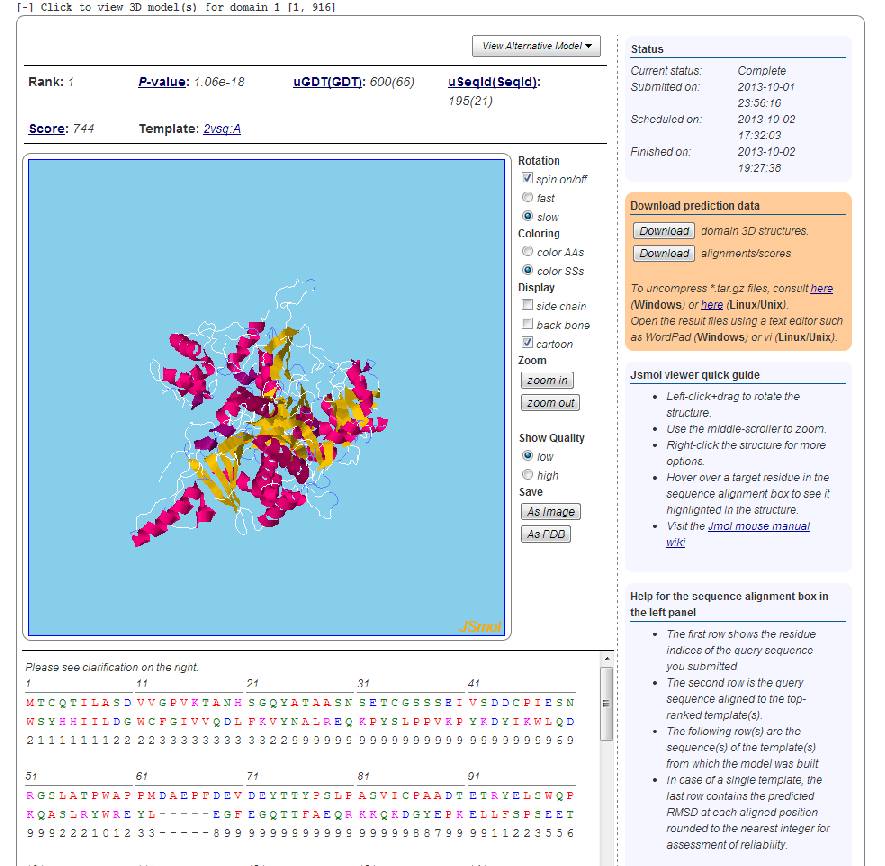
In a structure prediction job, a protein structure is built for each of the top-ranked alignments between the target sequence and the structures in the template library. The interface provides the rank of the currently selected alignment result, with the highest ranked model being selected as default (that based on the best template). The PDB code of the template for the currently selected structure model is also provided which will take you to structure record at the Protein Data Bank http://www.pdb.org. You can switch between alternative models by clicking the “View Alternative Model”-button.
A Jsmol viewer providing a visualization of the currently selected model is loaded underneath. Using the mouse you can rotate and zoom on the structure. Right-clicking the model will bring up a menu of further options for changing the visualization. To the right of the structure viewer a menu for controlling the representation of the currently selected model is available. Here the user can zoom on the structure, switch between coloring modes, and provide a wire-frame display of the structure. Right-clicking the model will bring up a menu of further options for changing the visualization.
The alignment of the target and template sequence used for constructing the current model is displayed below the Jsmol viewer. Each position in the alignment is color-coded according to the chemical nature of the residue. The scheme used is: Red=Hydrophobic, Blue=Acidic, Magenta=Basic, Green=Hydroxyl+Amine. Hovering over aligned residues will highlight the target residue in the Jsmol viewer.
The right-hand column provides information on the status of the prediction job and links for download of the prediction results, including the PDB files for the top-ranked with corresponding alignments. Below the box with download links a brief user guide for the Jsmol viewer is given.
- Model quality scores
- The quality of a selected structure model can be judged by several measures including Score, P-value, uGDT(GDT) and uSeqID(SeqID). Score is the alignment score falling between 0 and the domain sequence length, with 0 indicating the worst. uSeqID is the number of identical residues in the alignment and SeqID is uSeqID normalized by the domain sequence length and multiplied by 100. uGDT is the unnormalized GDT (Global Distance Test) score defined as 1*N(1)+0.75*N(2)+0.5*N(4)+0.25*N(8), where N(x) is the number of residues with the local predicted RMSD smaller than x. GDT is calculated as uGDT divided by the domain length and multiplied by a 100. You cannot rely on a single measure to judge the quality of a predicted model. Instead, you shall take into consideration three measures P-value, Score and uGDT(GDT). Meanwhile, P-value measures relative quality. For mainly alpha proteins, P-value less than 10^-3 is a good indicator. For manly beta proteins, P-value less than 10^-4 is a good indicator. uGDT(GDT) measures the absolute model quality. For a protein with >100 residues, uGDT>50 is a good indicator. For a protein with <100 residues, GDT>50 is a good indicator. Ideally, Score shall approximately equal to uGDT, but sometimes they differ a lot, so it is better to take the average of Score and uGDT to estimate the model quality.
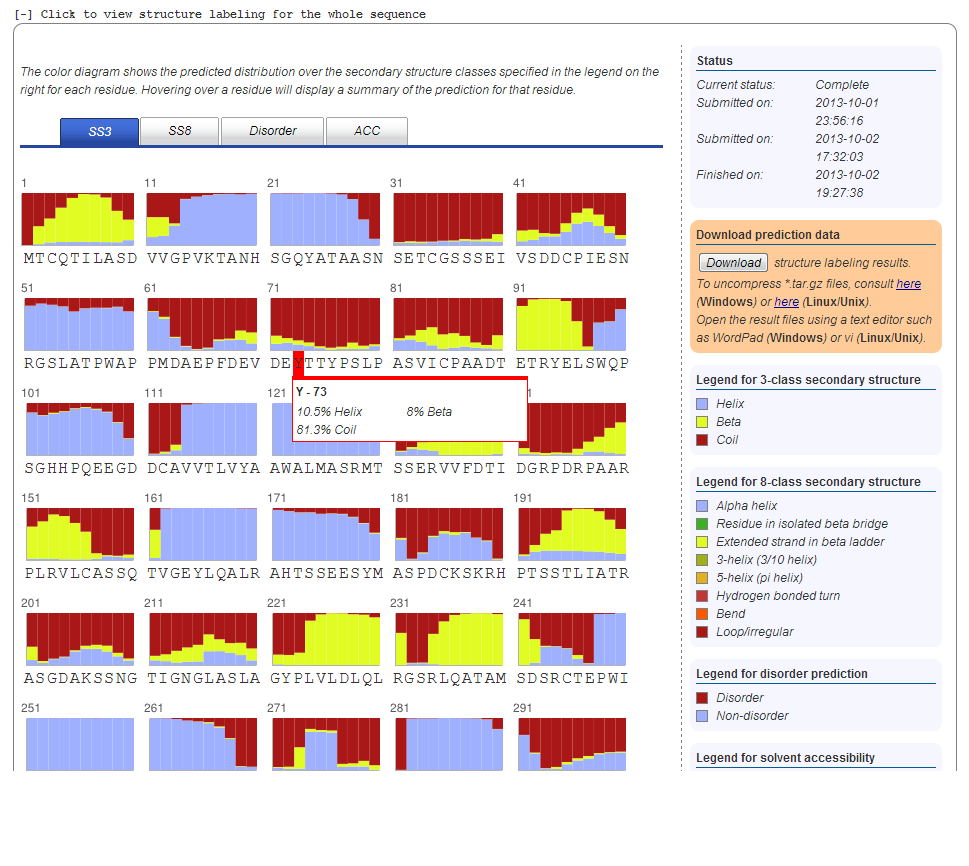
7. Secondary Structure Prediction
Secondary structure prediction is provided in two modes, using both three state and eight state models. You can switch between the two modes using the blue tab-menu. Hovering over a residue will display the exact distribution of secondary structure classes in a popup box appearing next to the residue. The 3-state secondary structure types are also abbreviated as H, E, and C, which represent helix, beta-sheet and loop, respectively. The legend for the color-coding of the structure classes can be found in the right-hand column. The right-hand column provides information on the status of the prediction job; Links for download of the prediction results, including the full class distribution for both models and the most likely secondary class sequence from the three-state model in PSIRED-like format (Buchan, et al., 2010).
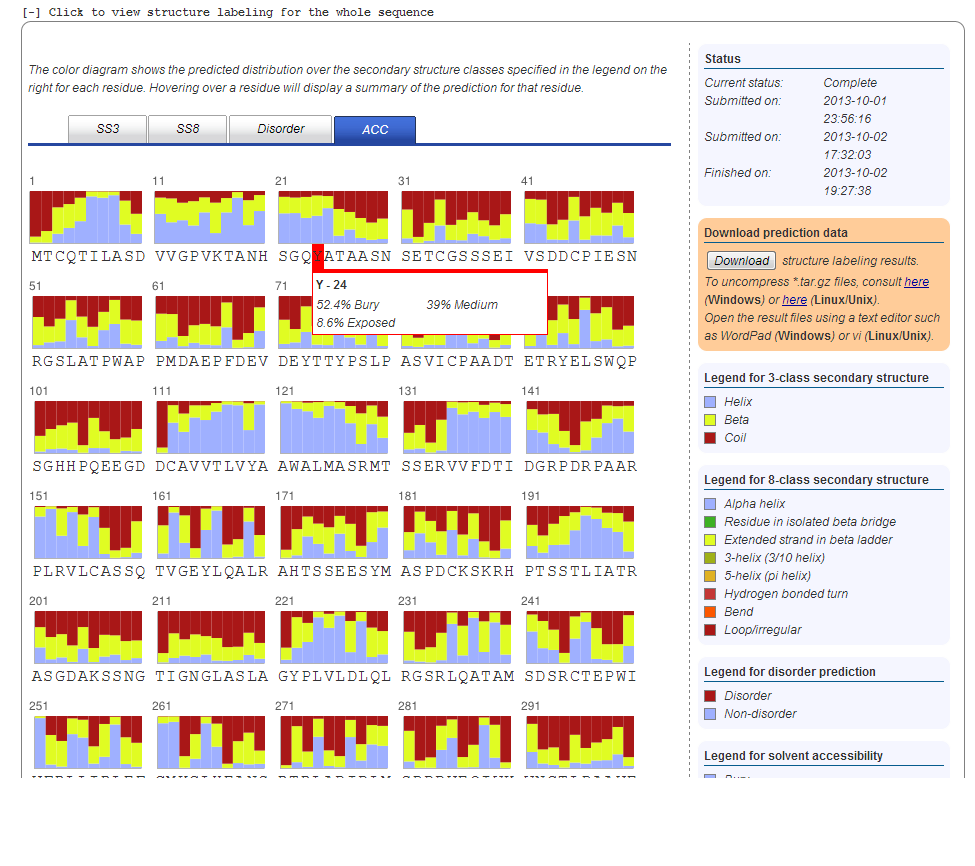
8. Solvent Accessibility Prediction
The solvent accessibility result is displayed similar to the secondary structure and disorder prediction results. We use 3-state solvent accessibility: buried, medium and exposed, which are abbreviated as B, M, and E, respectively. Meanwhile, "buried" indicates the solvent accessibility is less than 25% and "exposed" indicates the solvent accessibility is larger than 75%.
9. Binding Site Prediction
Please consult the tertiary structure prediction display for binding job result display. For binding pocket prediction, we have one more confidence score, Pocket Multiplicity, to indicate the quality of the predicted pockets. Pocket Multiplicity represents the frequency with which the selected pocket was found in the template structures. Tested on a set of 251 binding site benchmark, we found out that when pocket multiplicity is above 40, there is a good chance that the predicted pocket is true. See http://raptorx.uchicago.edu/BindingSite/documentation/ for detailed documentation for binding site jobs.
10. Contact Prediction
We display the probability of two residues being in contact (i.e., their distance falling in the range [0,8Å]). Higher probabilities are represented by darker color.
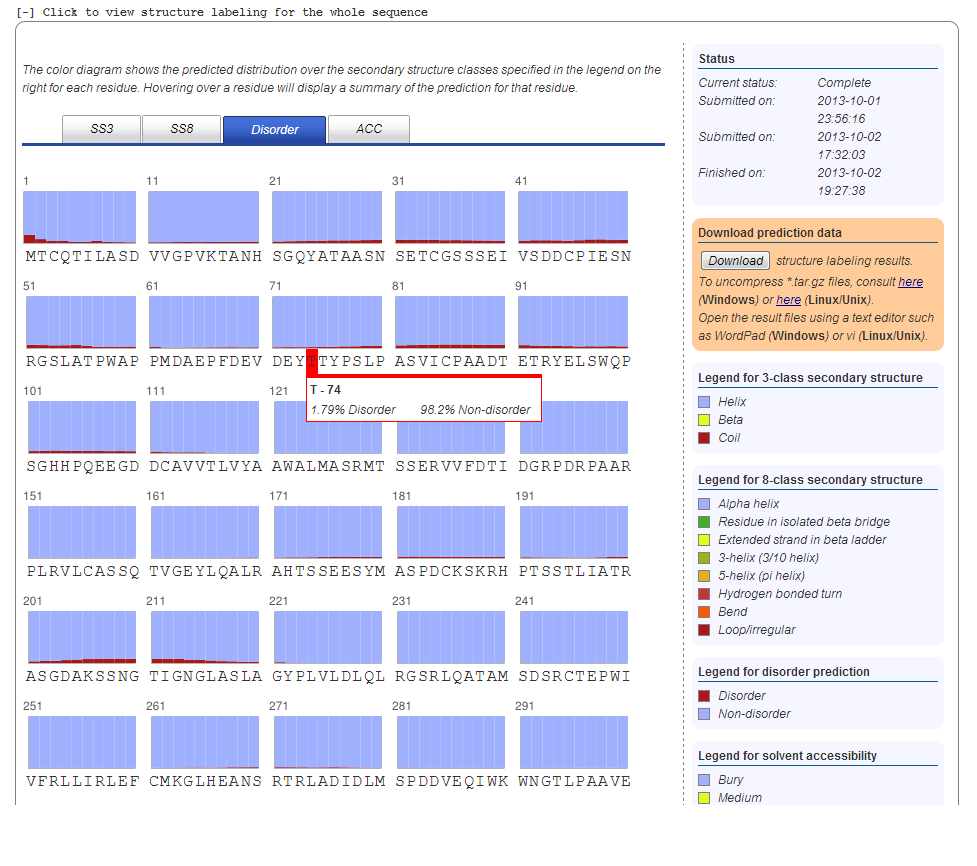
11. Disorder Prediction
If a structure prediction job has been submitted, a disorder prediction for the entire target sequence is also done. Graphics comparable to those described for secondary structure prediction are used to visualize the probability that a given residue is either in a disorder segment (marked in red) or non-disorder segment (marked in blue). Hovering over the residue will display the exact probabilities.